CX VERSION 1.48
ENHANCEMENTS
The following system-wide enhancements have been made to ConcentrixCX to enhance the user experience. These do not require any configuration.
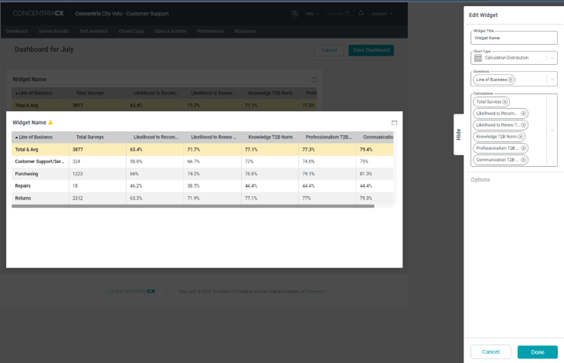
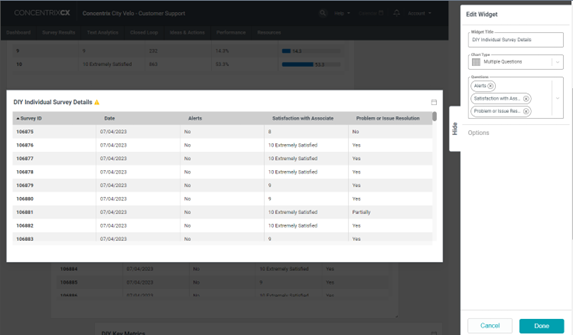
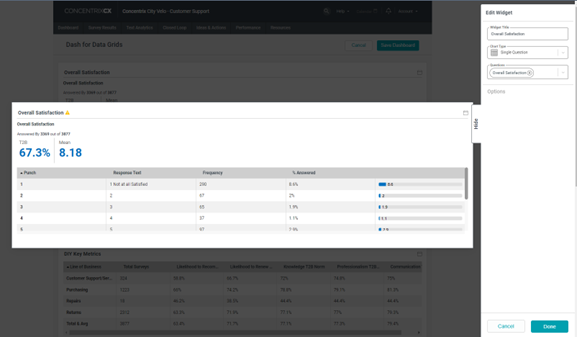
- Dashboard Builder – New Chart Types – Data Grid Charts are now available in the DIY Widget library in Dashboard Builder. Users can select between calculation distribution, multiple, or single question chart types.
** Calculation Distribution Question **
- Users can select one question and one to fifteen calculations to view the individual responses by customer/respondent. This results in a chart similar to the Cross Tab Metrics view.
** Multiple Questions **
- Users can select one to fifteen questions to view the individual responses. This results in a chart similar to the Individual Survey Details view.
Single Question
-
For Single Question, users can select a single question with no calculation to see the response distribution. This results in a chart similar to the Responses by Question view.
-
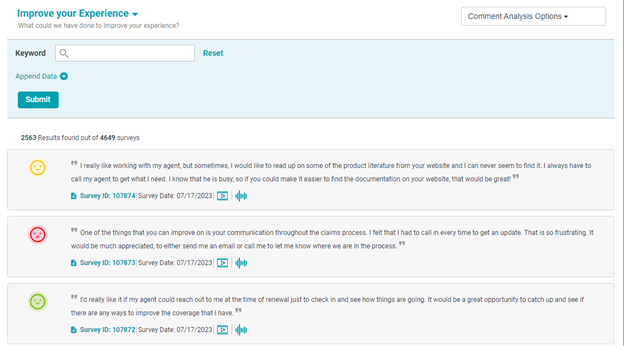
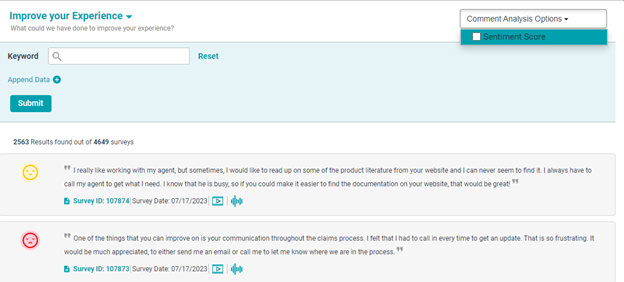
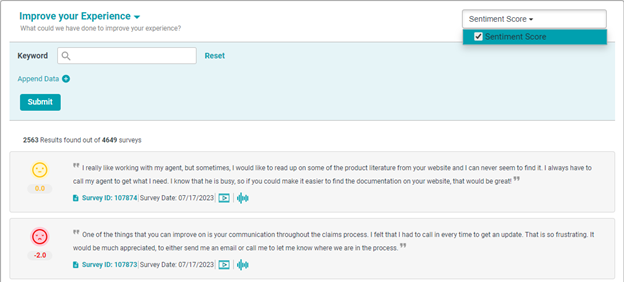
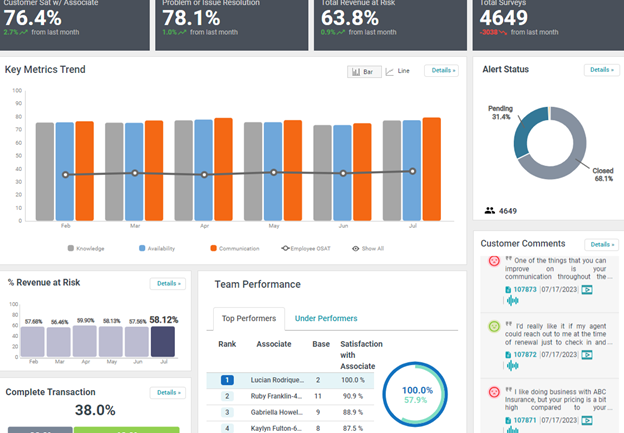
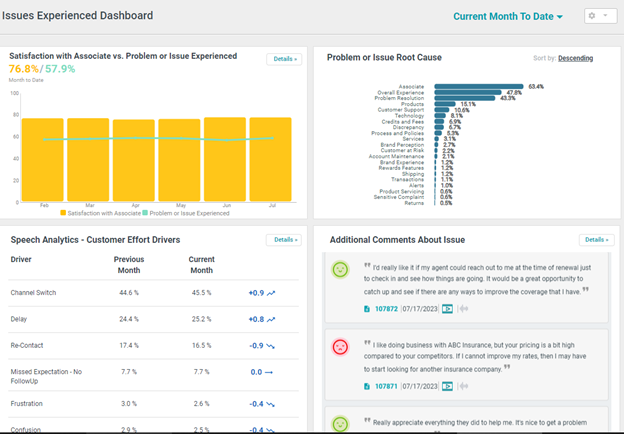
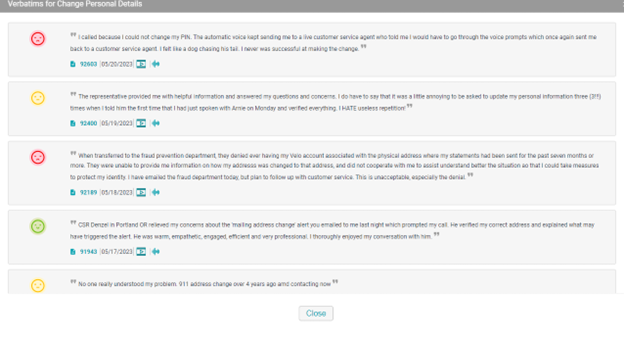
** Comments View UI Changes & Universal Sentiment Display – ** We have made some exciting updates to the sentiment graphics & display throughout ConcentrixCX! A summary of these changes is below:
- Updated Emoji graphics displayed by each verbatim comment.
- The Sentiment score no longer displays by individual verbatims for all CX views – the emoji will display only.
- The comments view now has an option for any verbatim that has sentiment tied to it – a user can turn on the display of the sentiment score in addition to the emoji, but only in the comments view.
The following system-wide enhancements have been made to ConcentrixCX to enhance the user experience. These require configuration and coordination with your CX Implementation and Deployment team.
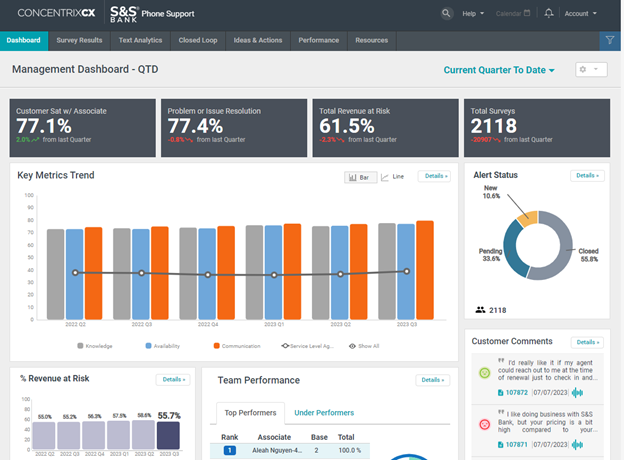
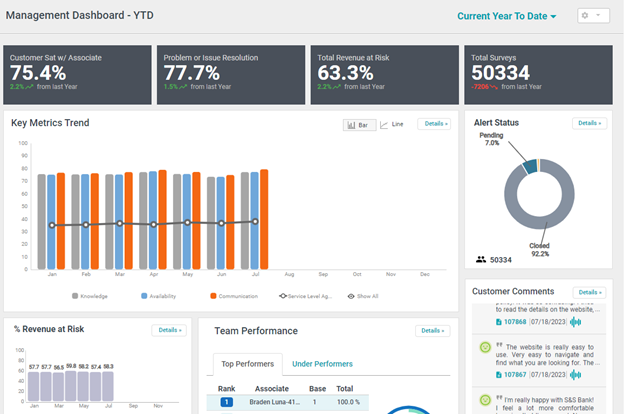
- ** Management Dashboard – QTD & YTD Options –** The pre-configured Management Dashboard templates now offer additional time-period trending options – Quarter-to-Date and Year-to-Date.
BUGS
The following bugs have been resolved. These do not require any configuration.
- Usage Reports – Quick-Date Buttons – Usage Reports were not updating properly when quick-date buttons were being utilized (other than Month-to-Date). This has been resolved, and the reports will function properly for all quick-date button options.
- Usage Reports – Search Option – The search option at the bottom of the Usage Reports view was not working properly, when attempting to search by a specific user. This has been fixed, and the search function has resumed operating properly.
- Grouped Bar Chart in Dashboard Builder – When selecting 13 or more for the month time interval, the data was not displaying properly in the grouped bar chart within Dashboard Builder. This has been corrected, and all will display properly now in this chart type, when selecting 13 or more months to display.